Here’s how Arch fixed it
[Service]
ProtectHome=read-only
PrivateDevices=no
DeviceAllow=/dev/urandom r
DeviceAllow=char-hidraw rw
According to a comment on the related polkit report ”That’s the correct way to solve these issues”.
[Service]
ProtectHome=read-only
PrivateDevices=no
DeviceAllow=/dev/urandom r
DeviceAllow=char-hidraw rwAccording to a comment on the related polkit report ”That’s the correct way to solve these issues”.
11.10.2
Ubuntu 26.04 (and probably any other Unix-like OS)
drwxrwxr-x root/root         0 2026-09-11 08:52 mattermost/
drwxrwxr-x root/root         0 2026-09-11 08:52 mattermost/prepackaged_plugins/
-rw-rw-r-- root/root  32570767 2026-09-11 08:52 mattermost/prepackaged_plugins/mattermost-plugin-calls-v1.12.2-linux-amd64.tar.gz
-rw-rw-r-- root/root       566 2026-09-11 08:52 mattermost/prepackaged_plugins/mattermost-plugin-calls-v1.12.2-linux-amd64.tar.gz.sig
-rw-rw-r-- root/root  15900090 2026-09-11 08:52 mattermost/prepackaged_plugins/mattermost-plugin-github-v2.7.1-linux-amd64.tar.gz
-rw-rw-r-- root/root       566 2026-09-11 08:52 mattermost/prepackaged_plugins/mattermost-plugin-github-v2.7.1-linux-amd64.tar.gz.sig
-rw-rw-r-- root/root  16578584 2026-09-11 08:52 mattermost/prepackaged_plugins/mattermost-plugin-gitlab-v1.13.0-linux-amd64.tar.gz
-rw-rw-r-- root/root       566 2026-09-11 08:52 mattermost/prepackaged_plugins/mattermost-plugin-gitlab-v1.13.0-linux-amd64.tar.gz.sig
-rw-rw-r-- root/root   9828026 2026-09-11 08:52 mattermost/prepackaged_plugins/mattermost-plugin-jira-v4.7.1-linux-amd64.tar.gz
-rw-rw-r-- root/root       566 2026-09-11 08:52 mattermost/prepackaged_plugins/mattermost-plugin-jira-v4.7.1-linux-amd64.tar.gz.sig
drwxrwxrwx root/root         0 2026-09-11 08:52 mattermost/
drwxrwxrwx root/root         0 2026-09-11 08:52 mattermost/prepackaged_plugins/
-rw-rw-rw- root/root  32570767 2026-09-11 08:52 mattermost/prepackaged_plugins/mattermost-plugin-calls-v1.12.2-linux-amd64.tar.gz
-rw-rw-rw- root/root       566 2026-09-11 08:52 mattermost/prepackaged_plugins/mattermost-plugin-calls-v1.12.2-linux-amd64.tar.gz.sig
-rw-rw-rw- root/root  15900090 2026-09-11 08:52 mattermost/prepackaged_plugins/mattermost-plugin-github-v2.7.1-linux-amd64.tar.gz
-rw-rw-rw- root/root       566 2026-09-11 08:52 mattermost/prepackaged_plugins/mattermost-plugin-github-v2.7.1-linux-amd64.tar.gz.sig
-rw-rw-rw- root/root  16578584 2026-09-11 08:52 mattermost/prepackaged_plugins/mattermost-plugin-gitlab-v1.13.0-linux-amd64.tar.gz
-rw-rw-rw- root/root       566 2026-09-11 08:52 mattermost/prepackaged_plugins/mattermost-plugin-gitlab-v1.13.0-linux-amd64.tar.gz.sig
-rw-rw-rw- root/root   9828026 2026-09-11 08:52 mattermost/prepackaged_plugins/mattermost-plugin-jira-v4.7.1-linux-amd64.tar.gz
-rw-rw-rw- root/root       566 2026-09-11 08:52 mattermost/prepackaged_plugins/mattermost-plugin-jira-v4.7.1-linux-amd64.tar.gz.sig
The installation instructions suggest extracting the files as non-root, which will result in the user’s umask being applied to the output files, so that’ll cause the world-writablity bit to get dropped (hopefully for most users).
It’d still be better though if the files were 0660/0770 (or at least 0664/0775) even when extracted as root. (Group-writability is enforced by the instructions’ sudo chmod -R g+w /opt/mattermost in any case.)
Selecting ”Add account” from the tray icon menu crashes the client.
Account creation wizard appears.
I don’t understand this question.
Linux
Ubuntu 24.04
Community PPA (please test with the AppImage package ?)
34.0.3.2
34.0.2-20260819.104017.ea499374cb-1.0~noble1
Minor version update (i.e. 33.0.0 → 33.0.1)
No
I tried the Appimage and it doesn’t seem to be affected (i.e. it doesn’t crash, and the account creation wizard appears).
I lied in answering ”Did this occur after an update or on a clean installation?” question above, because it’s been years since I’ve last tried adding accounts to the client and don’t really know the answer, but the choices given don’t account for this possibility.
”Debug archive creation is not available on this platform.” But I created a log according to the instructions in #10535’s comments and am attaching it here.
I just built 2.42.3, and it appears to have fixed this — maybe via [PR #9789](https://github.com/mattermost/mattermost-mobile/pull/9789#:~:text=bad%2Dcertificate%20reporting.-,Build%20Script,-File%3A%20scripts)?
Nevermind, this happened multiple times again today. Guess I just had a lucky streak of a couple of weeks there when it didn’t.
I think this might be fixed; at least I haven’t seen the Shortcuts failure notification in a while now, whereas before it was a daily occurrence.
This isn’t a real bug (although downloading without -o results in ”File name too long”, if filenames on the local FS are restricted to 255 bytes). I’m just making a note about Rony Rex trolling with the title: https://areena.yle.fi/1-78271849
Could make good test case. :)

I’ve reverted my live server back to 6.09 (and locked it there) for now.
On the testing VM I started from scratch: I deleted all existing data and reinstalled the 10.02 snap. Right after installing it’s working fairly normally, no noticeable slowdown, and ferretdb is down in double- or even single digits of CPU percentage.
I then exported my main working board from the live system (as JSON, 11 MB) and imported it into the VM installation. There was some noticeable slowdown right after, but eventually it settled back into working normally (i.e. no tangible slowdown).
But ferretdb’s CPU usage began to climb, until it was again using more than 160 % of the CPU.
Since then, I’ve tried to isolate the triggering cause from the import (if any), but no luck so far.
The only possibly relevant messages I’ve seen in the log during this were:
MaxListenersExceededWarning: Possible EventEmitter memory leak detected. 11 drain listeners added to [Gzip]. MaxListeners is 10. Use emitter.setMaxListeners() to increase limit
MaxListenersExceededWarning: Possible EventEmitter memory leak detected. 11 error listeners added to [ServerResponse]. MaxListeners is 10. Use emitter.setMaxListeners() to increase limitWith the snap update from 9.98 → 9.99, we’ve made some progress: Wekan now responds to requests from the proxy (thanks to xet7’s rapid fixes in #6476).
Instead, with 9.99 and now 10.00, it seems I’m hitting the performance issues others have reported (#6467, #6474) earlier.
My physical server is only a dual-core Pentium G630, but it does have 16 GB of RAM, and I’m the sole user of my Wekan instance, so it’s not a huge deployment. Then again, I have been running Wekan for years by this point, so there’s quite a lot of accumulated history tucked away in the archives.
I have a VM running another Wekan instance for testing purposes (with a setup cloned from the main server some time ago), and it’s affected by the same performace issues despite running with 4 virtual cores sliced from my main desktop’s more modern Core i7-8700 CPU.
Running top on the server shows ferretdb constantly using more than 100 % of the CPU.
Symptoms on the client side are varied. Only loading the login dialog seems to work without any delay; any problems occurring thereafter, as listed below, may or may not appear, probably because this is a performance issue, so it depends on how well/poorly the backend is doing.
Clicking the ”Sign In” button seemingly does nothing: no visible reaction, nothing in the browser console.
Logs from the server (journalctl -xeu snap.wekan.wekan) do show this though:
Occasionally the same error is shown on the login screen (in the browser).
After a couple of minutes, another previously reported issue (#6380): all fields aside from the language selector disappear from the login screen. A couple more minutes, and the username and password fields reappear, along with ”Authentication method”, with an empty dropdown menu (i.e. no options to choose from).
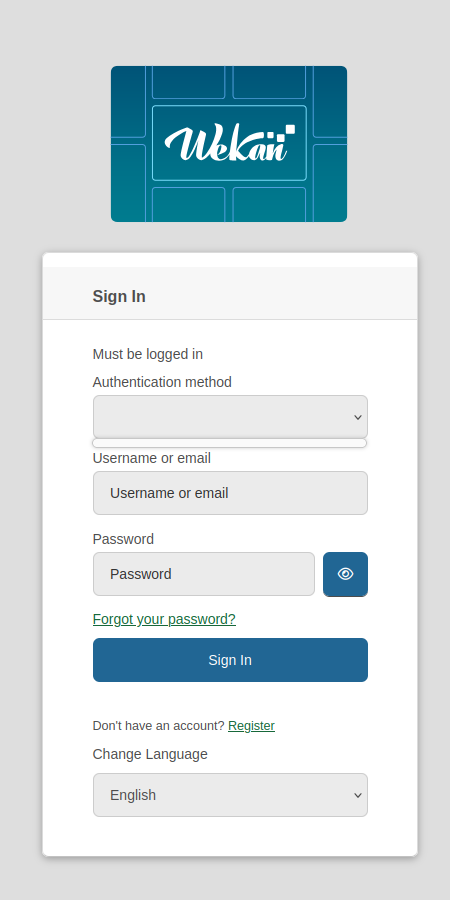
A few more minutes (and clicking the still seemingly non-functional Sign In button), and the main screen with my boards appears. I select one of them, and, after being stuck loading it for maybe half an hour (with only the header bar and the loading indicator dot animation visible), it then just says ”Page not found” where the board contents should be.
With 10.00 freshly installed, although perhaps just due to the fresh restart, the login appeared snappier, and I was able to get to the board, although it was still missing at all the attachments and my avatar. Later attempts to login (in a new browser window) seem just as slow as before.
I have one tab with the same board open from before the recent updates, so still displaying the old UI, and (somewhat curiously) it doesn’t appear to suffer from any slowdown. This could just be that it’s already loaded all of what the new tab tried to get from the DB. Alternatively, it’s not connected to the backed at all, despite not showing the usual warning, because any testing changes I make there don’t show up on the new UI (when I can get to the board).
Yesterday’s 9.95 had rendered Wekan (installed as a snap) inoperable, but from others’ issue reports and comments here I decided to wait until the fixes for those had been released.
With 9.98 now installed, the Wekan service itself seemingly starts without issues, but Apache (which is what I’m using for a proxy) still can’t connect to it:
http: attempt to connect to 127.0.0.1:3333 (127.0.0.1:3333) failed
Indeed, a netstat command confirms that port 3333 (which is what I’ve set Wekan’s port to) is not open.
My settings and output from snap info are below. I set debug=true, hoping to get more details, but it didn’t do anything.
Attached is all that journalctl -xeu snap.wekan.wekan.service logs for the service upon startup.
    # snap get wekan
    Key                         Value
    database                    ferretdb
    debug                       true
    mail-from                   Wekan <wekan.battra@[REDACTED DOMAIN]>
    mail-url                    smtp://127.0.0.1:25
    port                        3333
    richer-card-comment-editor  false
    root-url                    https://[REDACTED DOMAIN]/kan

    # snap info wekan
    name:      wekan
    summary:   Open-Source kanban
    publisher: Lauri Ojansivu (xet7)
    store-url: https://snapcraft.io/wekan
    contact:   support@wekan.team
    license:   MIT
    description: |
      WeKan is an Open-Source and collaborative kanban board application.

      Whether you’re maintaining a personal todo list, planning your holidays with some friends, or
      working in a team on your next revolutionary idea, Kanban boards are an unbeatable tool to keep
      your things organized. They give you a visual overview of the current state of your project, and
      make you productive by allowing you to focus on the few items that matter the most.
      Depending on target environment, some configuration settings might need to be adjusted.
      For full list of configuration options call:
      $ wekan.help

      Note: At https://snapcracft.io/wekan video 2023-12-08, after Meteor News, WeKan Interview starts
      at 22min 22sec.
    commands:
      - wekan.database
      - wekan.database-backup
      - wekan.database-list-backups
      - wekan.database-restore
      - wekan.help
      - wekan.maintenance
      - wekan.migrate
    services:
      wekan.caddy:    simple, disabled, inactive
      wekan.ferretdb: simple, enabled, active
      wekan.mongodb:  simple, disabled, inactive
      wekan:          simple, enabled, active
    snap-id:      jtpboSYvTCEyHoutkkRo1SI9ioSMOUb3
    tracking:     latest/stable
    refresh-date: tänään 02:03 EEST
    channels:
      latest/stable:    9.98 2026-07-17 (3457) 393MB -
      latest/candidate: 9.98 2026-07-17 (3457) 393MB -
      latest/beta:      9.98 2026-07-17 (3457) 393MB -
      latest/edge:      9.98 2026-07-17 (3457) 393MB -
    installed:          9.96            (3451) 393MB -
No response